Monday, October 19 | Post-Acute Care, Thought Leadership


A New National Benchmark for Personal Care Is Beginning to Take Shape
By Keith Dapprich, Director, Clinical Consulting Services
A potentially important shift in personal care took effect on July 1, 2026. Under the Centers for Medicare & Medicaid Services (CMS) Medicaid Access Rule, states were required to begin publicly reporting standardized fee-for-service payment information for several home- and community-based services, including personal care, home health aide, homemaker and habilitation services.
At first glance, this may look like another technical Medicaid reporting requirement. Its longer-term significance could be much greater. CMS may be (unintentionally) creating the foundation for the first meaningful national benchmarking infrastructure for personal care economics. As the data becomes more complete, and is eventually combined with direct care worker compensation reporting, it could influence provider strategy, payer negotiations, technology investment and M&A underwriting.
The old model: fragmented and difficult to compare
Historically, Medicaid personal care reimbursement information has been available only through a patchwork of state fee schedules, waiver documents, provider manuals, legislative appropriations and state-specific rate studies. The data was technically public in many cases, but it was rarely organized in a way that allowed an operator or investor to make a clean comparison between states.
A 15-minute billing unit in one program might need to be compared with an hourly rate in another. Some rates included geographic adjustments, modifiers or supplemental payments, while others did not. Similar services were often labeled differently from state to state.
Even when the numbers could be located, determining what providers were actually paid, and what level of utilization the rates represented, often required substantial interpretation.
The result was an industry in which state reimbursement environments could be described broadly but were difficult to benchmark consistently.
July 1, 2026 requirement
Federal regulations required each state’s initial publication to occur no later than July 1, 2026. The HCBS disclosures present Medicaid fee-for-service (FFS) payment rates in an average hourly format for designated service categories. Where applicable, states identify rates separately by population, provider type and geographic area. The disclosures also provide utilization context, including paid claims and the number of beneficiaries receiving the service.
This creates a more consistent reporting foundation and a common hourly unit for services that historically were difficult to compare. It does not create one clean national database.
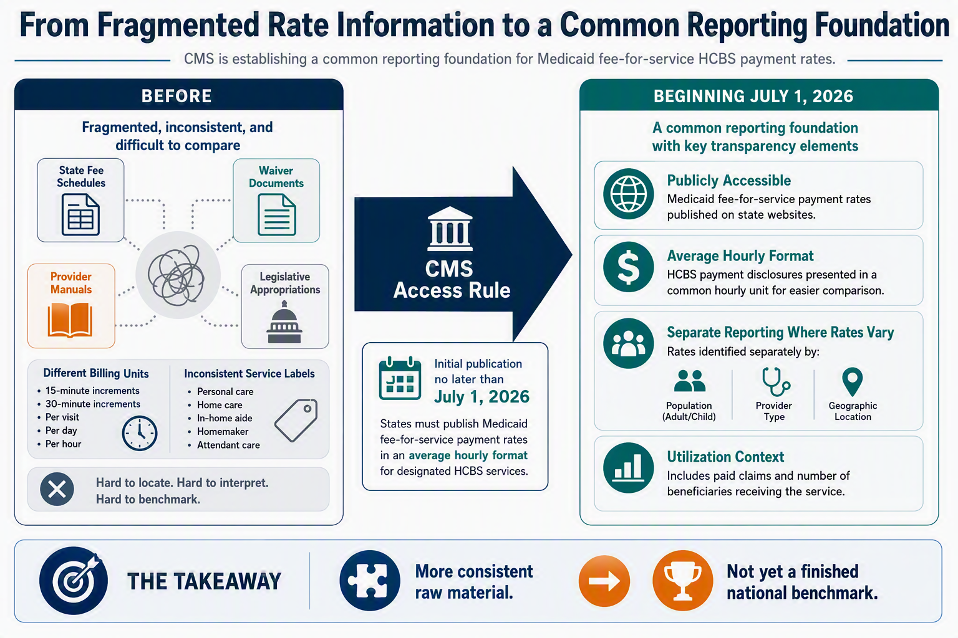
Figure 1. The rule creates more consistent raw material, not a finished national benchmark. Source: AI-generated image.
What data the early state disclosures include [early examples]
Several states have already published reports under the new requirement. The examples below show both the value of the new disclosures and the limits of direct comparison. These are non-exhaustive, used for illustration purposes only.
North Carolina
North Carolina’s CY 2025 disclosure identifies the program, service category, population, provider structure, average hourly payment rate and utilization information. For the statewide rows shown below, Personal Care Service is reported at $23.84 per hour with 33,504 beneficiaries, while Home Health Aide is reported at $37.55 per hour with 1,201 beneficiaries. These are distinct service categories and should not be combined.
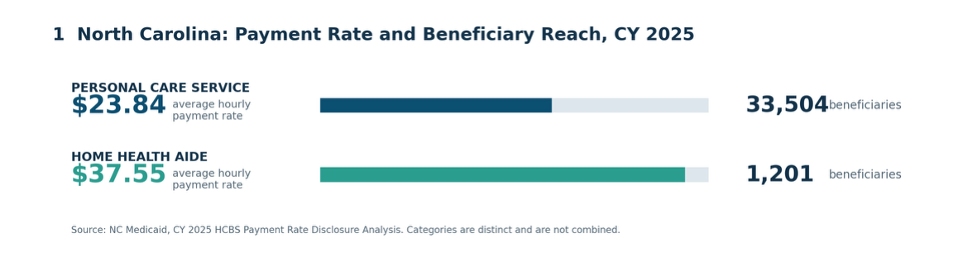
Figure 2. North Carolina statewide FFS rates and beneficiary reach, CY 2025. Source: NC Medicaid.
Pennsylvania
Pennsylvania’s disclosure shows relatively consistent non-facility personal care rates across its four regions, ranging from $29.98 to $31.87 per hour. Reported facility rates vary more significantly, including a $9.00 hourly equivalent in Region 3. Because Pennsylvania calculates these figures using claims-weighted fee-schedule rates and converts certain non-hourly payment methods using direct-care hours, the facility figures should be interpreted as state-reported hourly equivalents rather than assumed caregiver wages or directly comparable service rates.
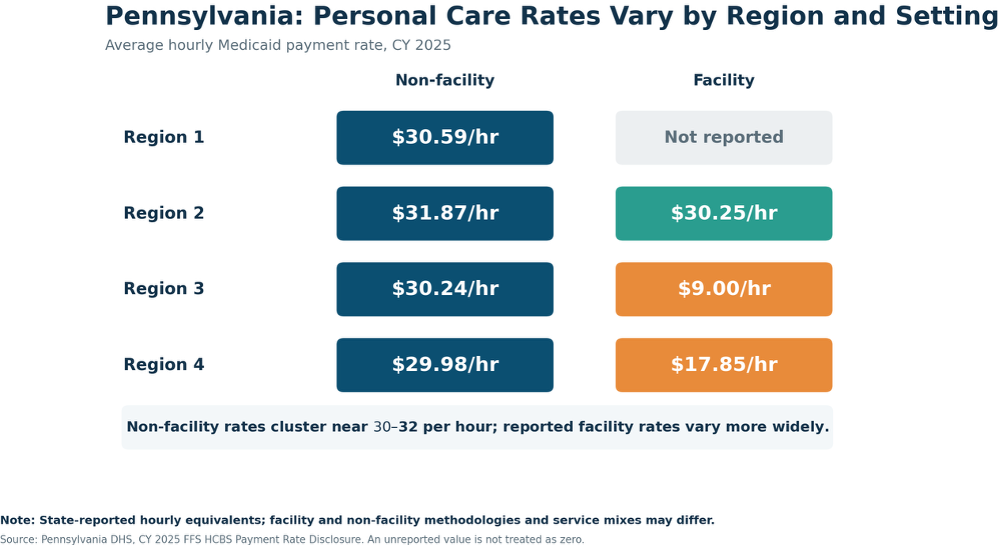
Note: State-reported hourly equivalents; facility and non-facility methodologies and service mixes may differ.
Figure 3. Pennsylvania personal care rate heatmap by region and setting, CY 2025. Source: Pennsylvania DHS.
Rhode Island
Rhode Island’s disclosure shows how payment rates can vary significantly across personal care delivery models and populations. Agency-based services are reported at approximately $44 to $45 per hour, compared with $20.94 per hour for the Individual, Non-DD category. The highest reported rate, $49.44 per hour, applies to a workplace category with only 293 paid claims and 35 beneficiaries, while the Agency, Non-DD category accounts for 491,964 paid claims and 2,746 beneficiaries. Presenting rates alongside utilization provides important context and reinforces why the categories should be evaluated separately rather than combined into a single statewide benchmark.
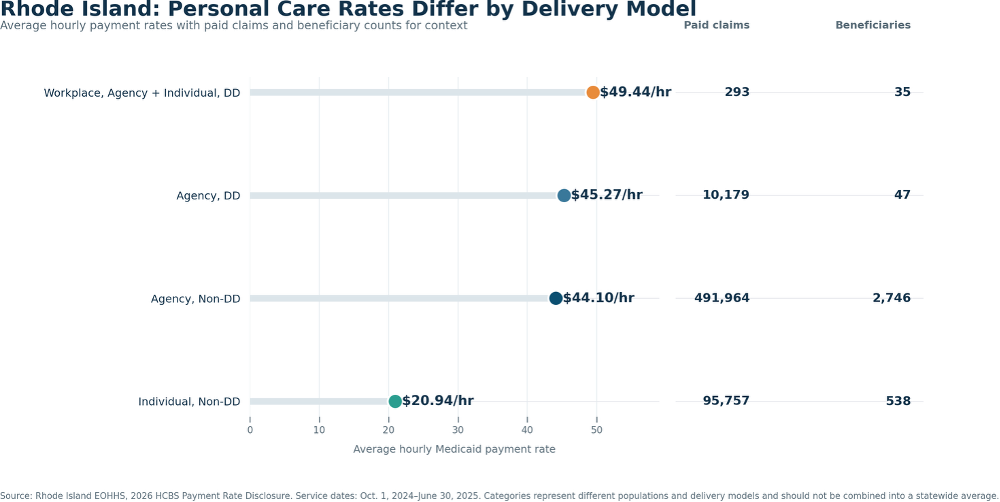
Figure 4. Rhode Island rates, claims and beneficiary reach by delivery model. Source: Rhode Island EOHHS.
Standardized data does not yet mean standardized analysis
CMS has standardized important reporting elements, but the underlying state programs and publication methods still differ. Analysts must continue to review service definitions, calculation methods, modifiers, unit conversions, waiver populations, delivery models and file formats before comparing results.
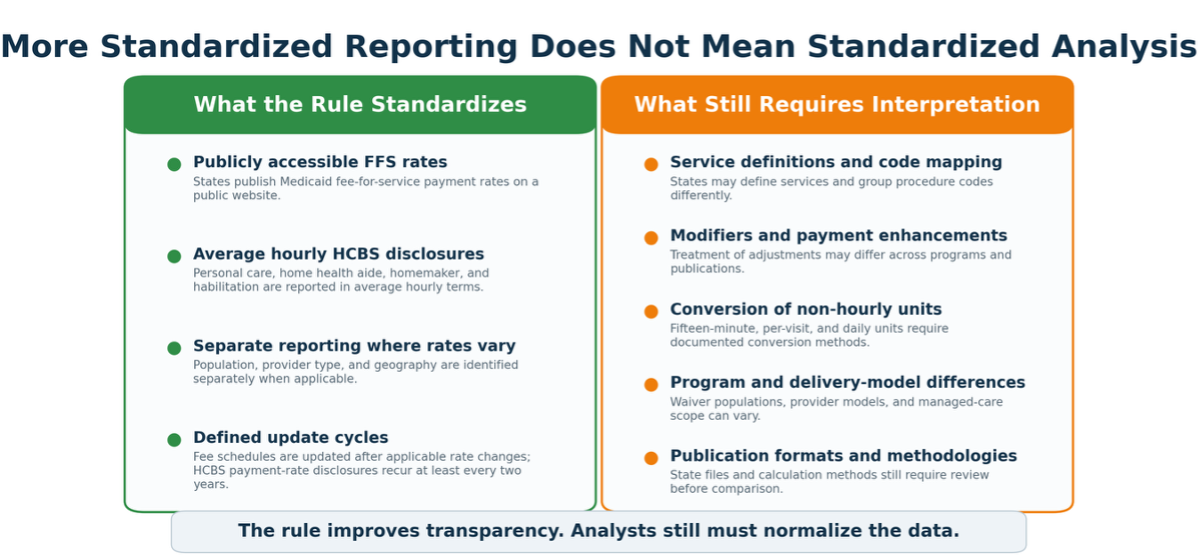
Figure 5. The rule improves transparency, but analysts still must normalize the data. Source: AI-generated image.
The general fee-schedule publication must be updated within one month following an applicable approved or effective rate change. The HCBS average-hourly payment-rate disclosure is published at least every two years. These related requirements should not be treated as the same update cycle.
Data normalization
Creating a credible, regularly updated national HCBS payment database could build something valuable for multiple parts of the industry. A normalized dataset could support comparisons of:
- Medicaid reimbursement per service hour
- Agency and self-directed payment models
- Rates relative to local caregiver wages
- Rate changes over time
- Geographic reimbursement differences
- Utilization and beneficiary volume
- The portion of reimbursement eventually flowing to worker compensation
- The implied amount remaining for supervision, recruiting, technology, insurance, compliance and margin
The value would not come simply from republishing public information. It would come from converting fragmented state reporting into comparable intelligence.
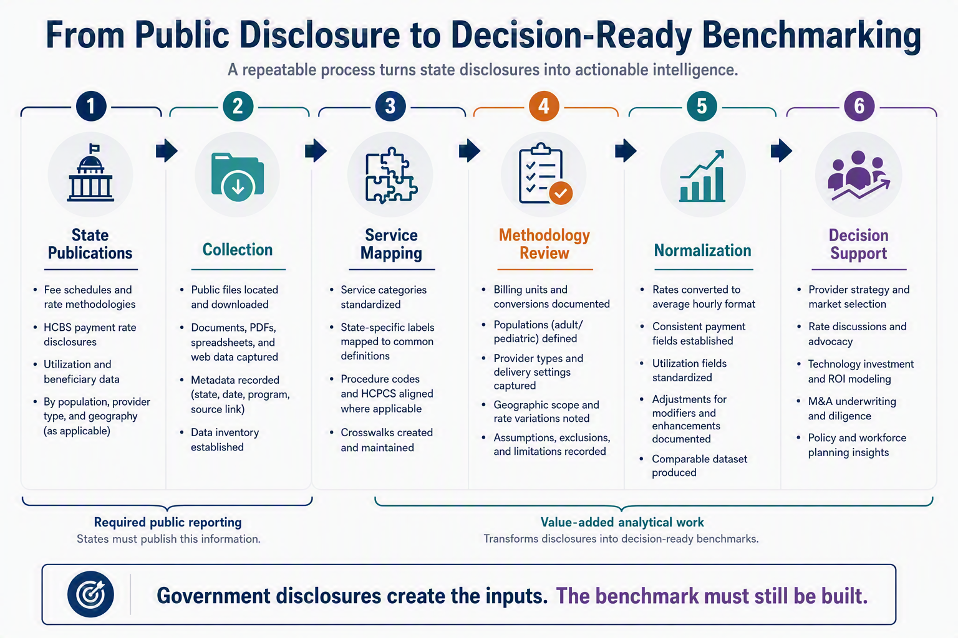
Figure 6. Government disclosures create the inputs. Decision-ready benchmarking requires additional analytical work. Source: AI-generated image.
Why this could matter across the industry
The disclosures do not create new strategic requirements for providers, payers, investors or technology companies. They may, however, provide more comparable information that those stakeholders can use in decision-making.
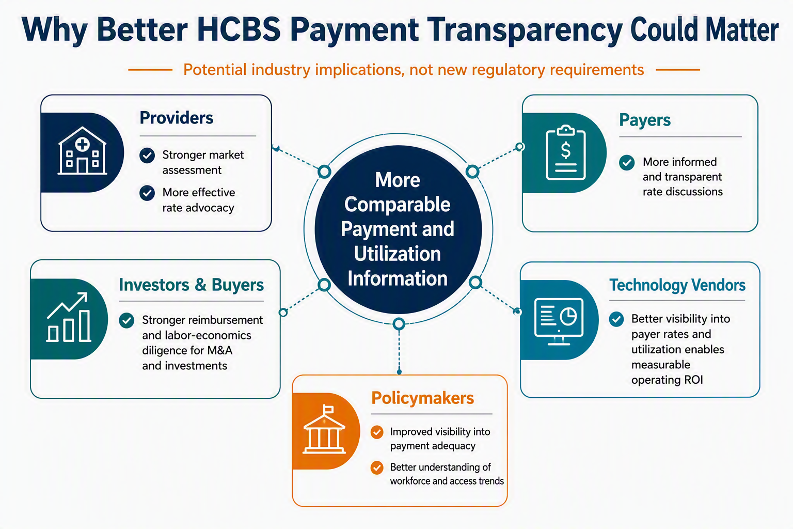
Figure 7. Potential industry implications of better HCBS payment transparency. Source: AI-generated image.
Why this could matter to providers
For personal care providers, normalized payment information could improve market selection and rate advocacy. Operators considering a new state often assess the current reimbursement rate without a strong longitudinal view of how consistently that state updates rates or how the rate compares with neighboring markets.
A national benchmark could help providers distinguish among markets with sustainable reimbursement and workforce economics, markets where rates have failed to keep pace with wages, states with attractive headline rates but costly operating requirements, and states where reimbursement policy appears to be improving or deteriorating.
The same data could strengthen negotiations with Medicaid managed care organizations. Instead of relying primarily on general statements about wage pressure, a provider could show how its contracted rate compares with state benchmarks, neighboring states, local labor costs and the administrative resources necessary to deliver the service.
Why this could matter for M&A
Personal care M&A has historically required buyers to reconstruct state-specific reimbursement and labor economics during diligence. A stronger national benchmark could make it easier to evaluate whether a provider’s margins are sustainable. Two companies with similar EBITDA margins may not have the same earnings quality.
One may generate its margin through strong scheduling density, low overtime, effective recruiting, high caregiver retention, efficient administrative operations, and accurate authorization and billing processes. Another may produce the same margin because caregiver wages have remained unusually low relative to reimbursement.
As reimbursement and worker-compensation data becomes more transparent, buyers may be better able to distinguish operationally earned margins from margins dependent on an opaque labor spread. That could affect valuation, diligence requirements and post-acquisition risk assessments.
Why this could matter to technology vendors
The reporting changes could also impact expectations for technology ROI. If a greater and more visible portion of Medicaid reimbursement is directed toward frontline compensation, providers may have less tolerance for technology that adds features without reducing operating cost or improving service delivery.
Technology vendors may increasingly need to demonstrate measurable improvements in unfilled-shift rates, caregiver retention, overtime, travel time, scheduler productivity, authorization utilization, EVV exception rates, billing speed and administrative cost per service hour.
The most valuable platforms may be those that help providers generate more completed and reimbursable service hours for each administrative dollar.
The compensation layer is still developing
It is important not to overstate what became available on July 1, 2026. The initial reporting primarily creates greater transparency into Medicaid fee-for-service payment rates and utilization. It does not yet provide a complete, standardized national view of the actual hourly wages paid to direct-care workers.
Additional reporting on the percentage of applicable Medicaid payments spent on direct-care-worker compensation is scheduled to develop in later implementation phases. MACPAC has separately recommended greater reporting of actual hourly worker wages. The national benchmarking thesis is therefore still partly forward-looking. But the first layer is now live.
The bigger takeaway
The July 1 deadline did not instantly create a clean national database of personal care economics. It did something more foundational: it required states to begin producing more consistent raw material from which that database can be built. In the old environment, reimbursement information was dispersed across state-specific documents and difficult to compare. In the emerging environment, it appears core payment and utilization fields are becoming more standardized, even though the files and methodologies still require normalization.
Over the next five years, that shift could make personal care providers and states easier to compare, underwrite and consolidate, but harder to operate through economic models that depend on limited transparency. The most consequential development may not be the government disclosures themselves. It may be what providers, investors, consultants and technology companies build from them.
How McBee Can Help: McBee supports investors and post-acute organizations with compliance, market benchmarking, strategic planning, and data analysis to inform investment, growth, and operational decisions. Ready to turn market intelligence into action? Connect with a McBee consultant to explore opportunities for growth, optimization and long-term value creation.
Sources
Meet the Author

Keith
Dapprich
· Director, Clinical Consulting Services
Communities
Solutions and Services
From the CareThreads Blog
A New National Benchmark for Personal Care Is Beginning to Take Shape
Monday, October 19 | Post-Acute Care,Thought Leadership
A potentially important shift in personal care took effect on July 1, 2026. Under the Centers for Medicare & Medicaid Services (CMS) Medicaid Access Rule, states were required to begin publicly reporting standardized fee-for-service payment information for several home- and community-based services, including personal care, home health aide, homemaker and habilitation services. At first glance, this may look like another technical Medicaid reporting requirement. Its longer-term significance could be much greater.
Read the blog
The Hidden Gaps Driving Audit Risk in Post-Acute Care
Wednesday, October 07 | Post-Acute Care,Thought Leadership
Organizations can no longer afford to approach audit readiness as the responsibility of one department. It requires a connected strategy that spans the entire revenue cycle and helps identify risk before it becomes an audit finding.
Read the blog
The Metrics Driving Sustainable Senior Living Growth
Why growing census does not always produce healthier margins, and what leaders should measure instead
Tuesday, October 06 | Care Coordination,Post-Acute Care,Thought Leadership
Over the years, occupancy became a go-to statistic for senior living. It showed if your building was full, you were generally making more money, but the economics of senior living have changed.
Read the blog